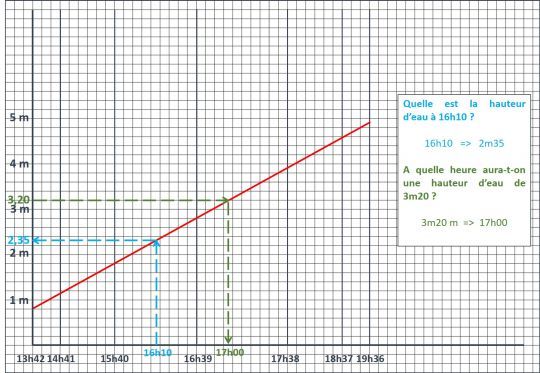
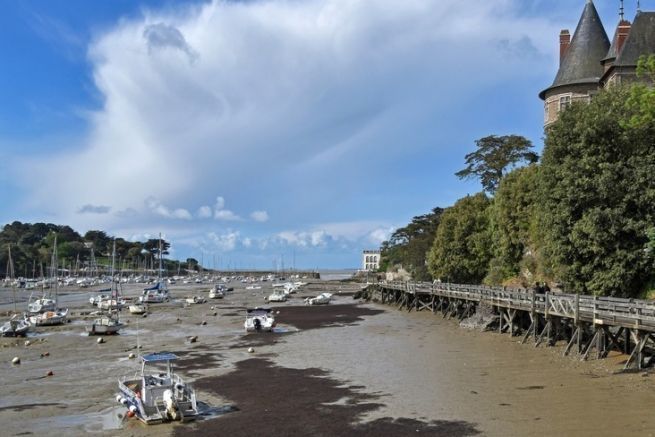
Instead of using the tedious calculation of twelfths, it can be interesting to determine the height of water with a simple graph that can be made on a simple graph paper. This will have the advantage of being able to determine the height of water by an easy reading of the graph at any time between two tides. This graphical method is a little less precise than the calculation (but still enough to be used validly in boating with a reasonable pilot's foot).
1st step: find the tide information and make corrections
It is necessary to know: the tidal coefficient, the times and the heights of the high tide (HW) and low tide (LW) at the main port, then make the necessary corrections:
- Secondary port corrections: make height and time corrections based on your port or sailing area (see the secondary port corrections table in your tide directory)
- Check that the schedules you are using are in legal hours, if not make the necessary corrections (for example, the tide times of the SHOM are in TU+1 all year long and it is necessary to add 1 hour from April to October because the legal time is in TU+2)
- Corrections related to barometric pressure: the water heights are given for a pressure of 1013 hectopascal. If the pressure is higher: the water heights will be reduced by 1 cm per additional hectopascal (e.g. an atmospheric pressure of 1033 hPa will give 20 cm of water height to be minored compared to the water heights displayed by the tidal directory). On the other hand, if the pressure is lower, the water heights will be increased by 1cm per hectopascal below 1013 hPa.
Thanks to this information, it is now possible to calculate the tide time. Tides do not last exactly 6 hours: at certain times of the year, they can last longer (e.g. 6:45 am) and sometimes less time (e.g. 5:15). It is therefore necessary to recalculate at each tide the value of the tidal hour: the easiest way is to convert the time between each tide into minutes and then divide this figure by 6.
Concrete application on a tide at Port Haliguen
We are trying to know the water height at any time near Port Haliguen, on April 25 in the afternoon. The tide directory indicates for Port Navalo a low water at 13:47 for 0.60 m water height and a high water at 19:54 for 4.55 m water height. The tidal coefficient is 45 (neap tides). The atmospheric pressure is 1003 hPa.
Correction of the timetable : at Port Haliguen (secondary port in neap) : -20mn for the PM and -5mn for the BM. The schedules at Port Haliguen are therefore BM 13h42 and PM 19h34. The directory gives us the schedules in legal hours, so there are no other corrections to make.
Water level corrections: secondary port in neap tide +0.25m for the PM and +0.10 m for the BM. The water heights at Port Haliguen are therefore : BM 0.70 m and PM 4.80 m. Moreover, the atmospheric pressure of 1003 hPa requires us to increase these values by 0.10 m. The water heights to be taken into account will therefore be BM 0.80 m and PM 4.90 m.
Calculation of the tidal hour: between 13:42 and 19:34, there are 5 hours or 300 minutes + 18 minutes + 34 minutes or 352 minutes / 6 = 59 minutes.
2nd step: build the base of the graph on graph paper
Take a sheet of graph paper (or millimetre if you want more precision) then plot the graphical base according to the model below :
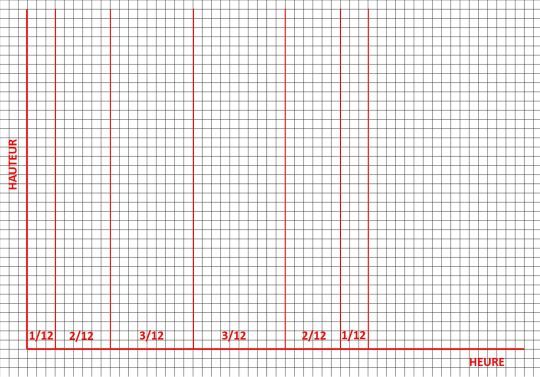
The twelfths can be spaced more or less depending on the size of the grid: the more the vertical lines are spaced, the more precise the reading will be. The example here is based on the size of an A4 block sheet.
3rd step: position the times and heights on the graph
According to the time of the calculated tide, position the tide times on the graph.
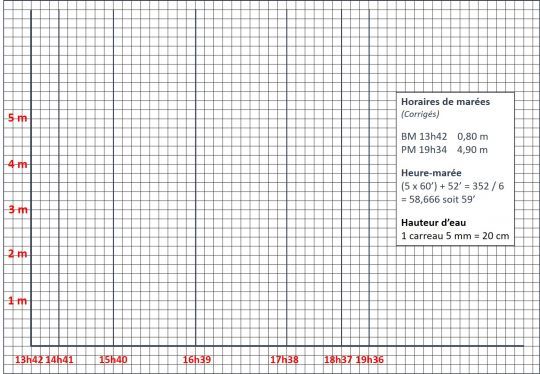
For heights, choose a scale according to the tidal range 1 tile 5mm for 20cm of tidal range / 1 tile 5mm for 10cm of tidal range / 2 tiles 10mm for 50cm of tidal range, ...
Draw the tide line
Locate on the grid the point corresponding to high tide and the point corresponding to low tide and draw a line between these two points.
It is now very simple to determine : the water level for a given hour or at what time we will have a desired water level (see examples on the graph)
