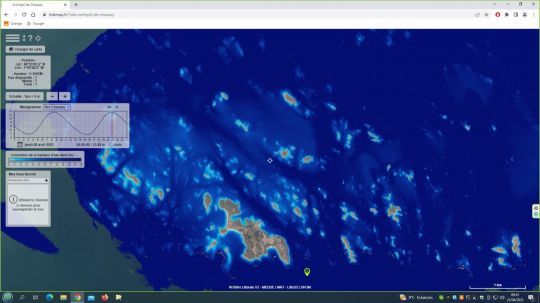
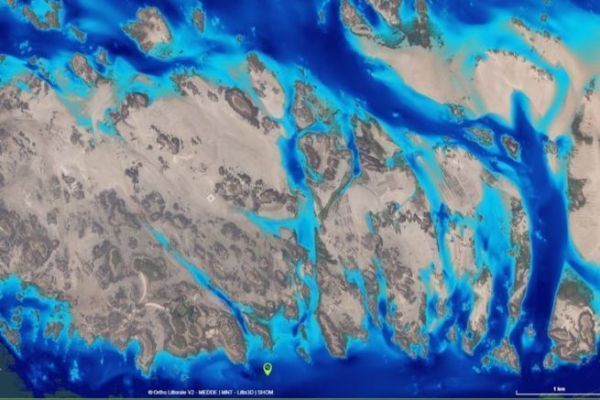
Patrick Dubois sails in the waters of Bréhat in Northern Brittany. When the SHOM published the Litto3D charts, this sailor had the idea to compile them with the data from the tide gauges present on the coast. Thus, with the drawing of the bottom and the water heights, the software can calculate the water height above a point on the coast.
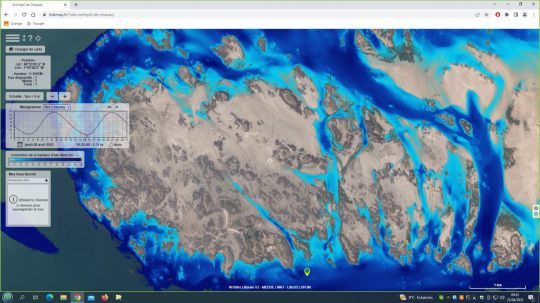
Tidemap, to know the water level in any point
Thus were born the Tidemap maps, at first for the personal needs of its creator on the Ile Verte in Brehat, then on all the Breton coast. From now on, the coverage area goes from Granville to the Gulf of Morbihan. The area of Belle-Île, Houat and Hoedic should soon complete the catalog.
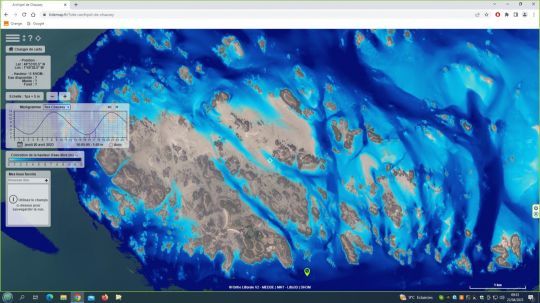
Access by subscription
Access to these cards is by subscription. A unique annual subscription of 20 euros for all of Brittany! The software gives access to a calendar with the tidal coefficients, but above all the possibility to integrate a pilot's foot on his map, to place the non-navigable zones in red for example.
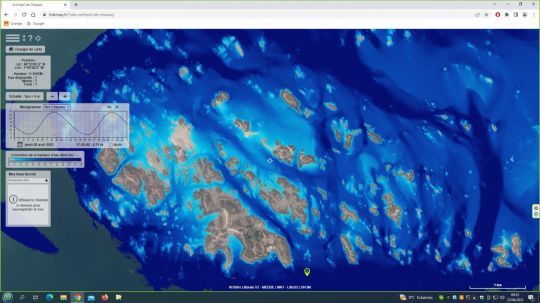
An educational tool
However, this tool is not a navigation software, because the SHOM does not diffuse the Litto3D charts to be used for navigation. Tidemap does not propose to be located with a GPS. It is above all an educational tool to make discover the tides to those who do not know, a playful tool to play with the hours and discover the sea which leaves and returns. Finally, an information software that could be suitable for tourist areas and to secure fishing to warn some users.
