Measuring waves
The sea surface is mainly deformed by the effect of the wind, both the local wind and that of storms that have occurred far away and whose wave trains have propagated. We can thus distinguish between the wind sea, created locally, and the swell, which has been propagating for longer. Like any wave, these undulatory phenomena can be described by a few basic characteristics: their period and amplitude. The former is expressed in seconds, the latter in meters, and is more commonly referred to as the peak-to-valley height for waves.
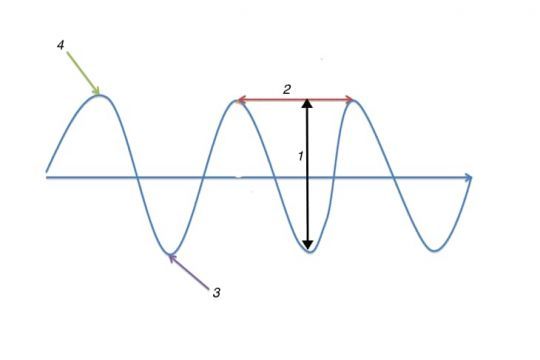
In a given place and at a given time, the sea, known as the total sea, is the sum of the wind sea and the swell. While the period is essential for the surfer, it is generally less so for the sailor, even if we know that a short period will mean closer waves and rougher seas for the boat. In the rest of this article, therefore, we'll be focusing on height.
Transcribing the perception of the sea
Every sailor knows that two successive waves are never strictly identical, and certainly not of identical height. However, it is impossible to give the peak-to-valley height of each wave in a forecast. We have therefore defined the significant height. This is the height perceived by the observer who is asked to give the wave height. Experience has shown that it corresponds mathematically to the average of the highest third of waves: out of 99 waves, the 33 highest peak-to-valley heights are selected and averaged. This is called H1/3.
Douglas scale
The Douglas scale, named after Sir Henry Percy Douglas, a British naval officer during the First World War, is now used to easily describe sea conditions. Less well-known than the Beaufort scale for wind, it has 10 steps:
- 0 - Calm - 0 m waves
- 1 - Wrinkled - waves from 0 to 0.1 m
- 2 - Beautiful - waves from 0.1 to 0.5 m
- 3 - Lightly agitated - waves from 0.5 to 1.25 m
- 4 - Restless - waves from 1.25 to 2.50 m
- 5 - Strong - waves from 2.50 to 4.00 m
- 6 - Very strong - waves from 4.00 to 6.00 m
- 7 - Large - waves from 6.00 to 9.00 m
- 8 - Very large - waves from 9.00 to 14.00 m
- 9 - Huge - waves over 14.00 m
Just as it's customary to expect wind gusts to be much higher than the constant wind, the same applies to waves. Météo France tells us that the probability of one wave in 100 reaching 1.5 times the average height (H1/3) exists, and that it's even possible for one wave in 1000 to reach 1.8 times this average height.
In its marine guide, Météo France illustrates its presentation of the weather as follows. :
When a significant swell is present or forecast, it is described.
If, among all the wave trains present, swell is significantly predominant, "total sea" dominated by "swell" or "total sea" by swell of ... is specified, followed by a description of this swell.
Example: in an area with little wind (no significant wind seas), but subject to a 5m north-westerly swell, we would write "very heavy seas in a 5m north-westerly swell".

 /
/ 